The 2022 Investment Quilt Chart

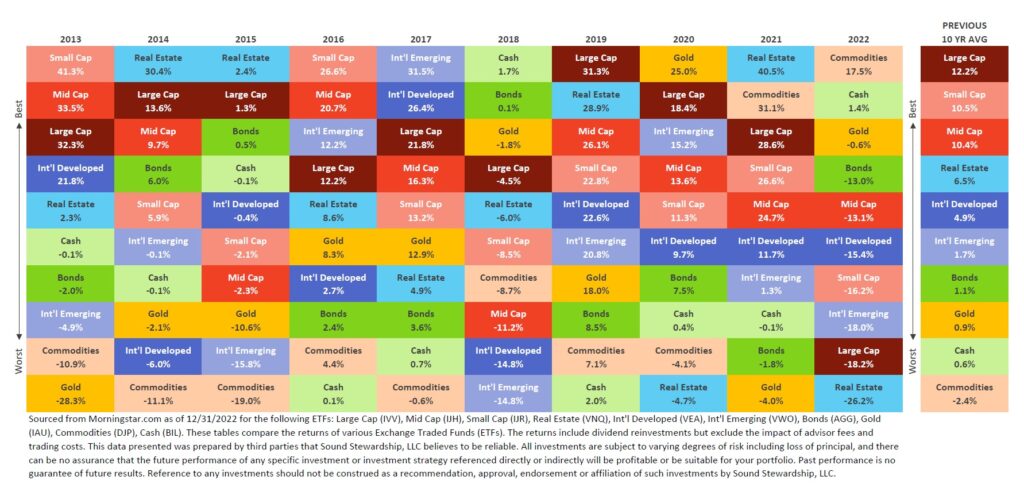
The above image is our annual update to the “Asset Quilt Chart”, showing how different investment classes did last year and each of the previous 9 years before. The column on the right shows the 10-year average for each investment class across that period.
Last year was a challenging year for most investments. It was particularly unusual in the way that both stocks and bonds suffered double-digit returns. However, care should be taken to compare those single-year returns with the 10-year averages for each category.
< Back to Insights